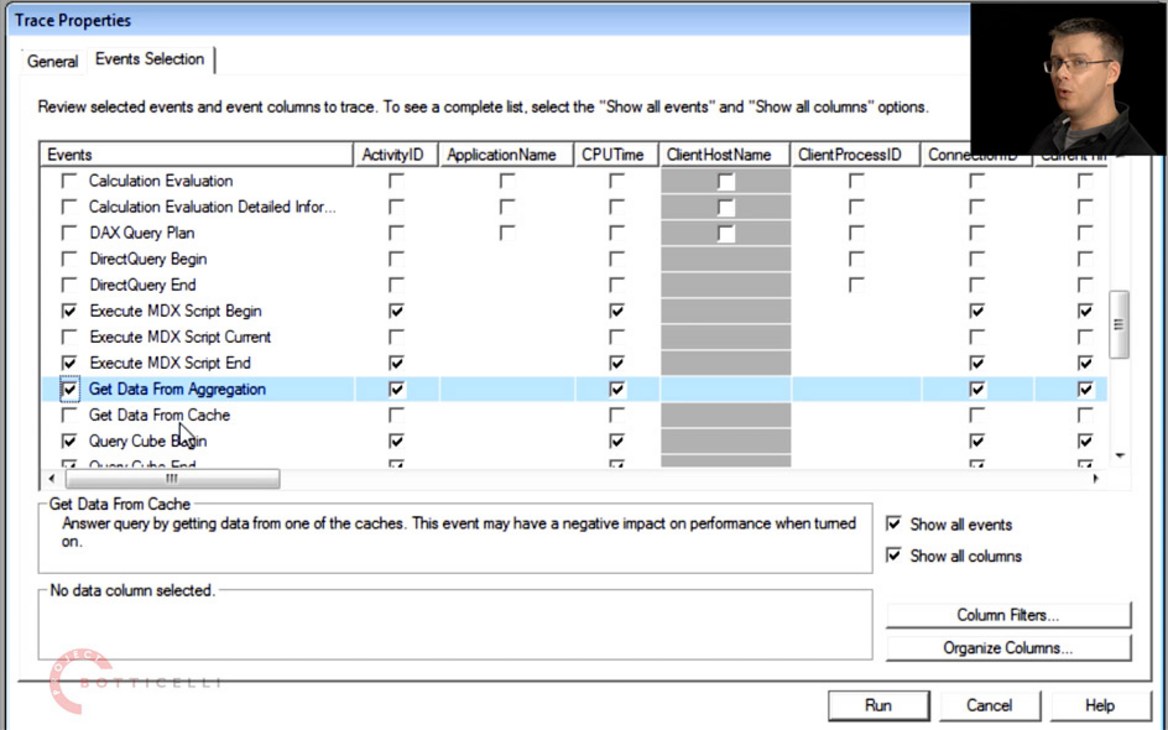
In this 30-minute video Chris Webb explains how to use the SQL Server Profiler to diagnose why an MDX query is slow. First, however, he explains what goes on inside SQL Server Analysis Services when a query is run. There are two main parts to Analysis Services: the Formula Engine and the Storage Engine. The Formula Engine parses your query and then works out what data is needed to answer it; it then makes multiple requests to the Storage Engine to get this data, then once it has the data it needs it performs any MDX calculations that are necessary, and it returns the results back to the end user.
The Storage Engine can be thought of as something like a simple relational database that can only accept SQL GROUP BY queries—its purpose is to aggregate data. It can aggregate data from the fact table level data that is loaded during processing; it is also able to aggregate data from any aggregations that exist in the partition, or from data that is present in its cache.
The requests the Formula Engine make to the Storage Engine take the form of subcubes of data. A subcube is a slice of data aggregated to a particular granularity, optionally filtered in some way. Ideally the Formula Engine is able to request all of the data it needs for a query upfront, even when calculations need to be performed in the query. However for some calculations the Formula Engine is unable to work out what data it needs before it performs these calculations, which means it has to request the data for each calculated value when that value is calculated. This relatively inefficient way of working is generally known as cell-by-cell mode and it can lead to slow query performance.
You can use SQL Server Profiler to monitor requests going between the Formula Engine and the Storage Engine, and also to monitor what’s going on in the Storage Engine. However Profiler does not give you much useful information about what is happening inside the Formula Engine. There are a number of useful Profiler events that can be used for this monitoring mentioned in the video. One of the most useful of these events is Query Subcube Verbose: it tells you what data is being requested from the Storage Engine by the Formula Engine, and also how long the Storage Engine takes to answer these requests.
Watch this video to learn the steps necessary to use the SQL Server Profiler to identify performance problems in your queries, which is a necessary prerequisite to MDX performance tuning.


