6 March 2013
Excel 2013 BI, SharePoint 2013, and Microsoft Business Analytics
When you registered, you asked to be notified about new content—here's our newsletter, sent every month or two.
Summary of New Content:
- Geospatial Data Exploration with Excel Power View and SharePoint (16-min video, registered members)
- Microsoft Business Analytics with Office 2013, SharePoint 2013 and SQL Server 2012 (1-hour 20-min video, Full Access Members)
- Microsoft Business Analytics Roadshow updated slides (4 PPT decks, registered members)
Geospatial Data Exploration with Excel Power View and SharePoint
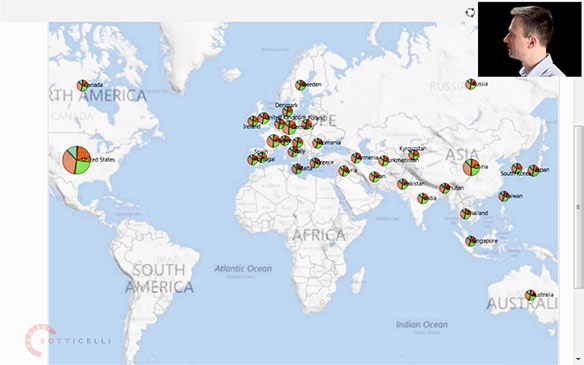
Have you ever wanted to create a zoomable map of the world that shows your own data and that has full interactivity, ability to drill it, filter and so on? Indeed, this has been one of the most demanded features on the Microsoft BI team's to-do list. In this short, 16-minute video I show you how, at last, this is all very easy in Excel 2013, which now includes the new Power View inside it. Best of all, your data is automatically aggregated at the levels of your geospatial hierarchy, such as city-region-country, and you don't even need longitude and lattitude information! This is done automatically for you, thanks to Bing offering its intelligence to us. This free video is only available to our registered members at the moment. We plan to make it available to everyone in a few weeks, so have a peek while you have your exclusive priority access, before everyone else does!
Microsoft Business Analytics with Office 2013, SharePoint 2013 and SQL Server 2012
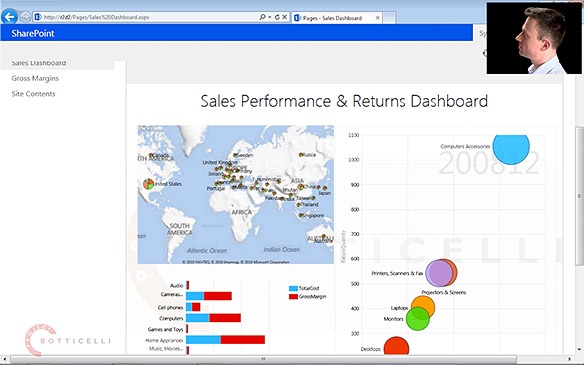
Microsoft Business Analytics combines business intelligence with data warehousing and big data analytics. This 1-hour 20-minute video, which I have just recorded, introduces this concept by showing you how real-world analytics, created by a power user in Excel 2013, can be shared with others in a company, using SharePoint Server 2013, and subsequently scaled-up to the needs of an enterprise, by means of a SQL Server 2012 SP1 Analysis Services Tabular Model. I cover the entire subject broadly, showing you some of the newest Excel and SharePoint 2013 BI features, including more examples of the geospatial technology, data models, quick explore, timelines, and, above all, I show you how it all comes together as an elegant, and a well-integrated platform for business analytics. The core of this video is an extensive, 9-part, 55-minute, high-def demo, focusing on the enterprise lifecycle of user-created analytics, a process that I see taking place in many organisations, where user-created analytics suddenly needs to be secured, scaled to run for 1000s of users, and shared in beautiful dashboards. I built this demo scenario for my current BI roadshow, to show how Excel, SSDT, and SSAS tabular work together. This is your chance to see the demo that some 3000 people have been travelling to see me perform it live, on stage, this year.
News
Microsoft have just shipped PolyBase for the new, in-memory enhanced, Parallel Data Warehouse 2012, the newest incarnation of their analytical appliance—you can start ordering it this week. PolyBase is an example of making big data no different from the rest of your data sources. I strongly believe that it should not matter to the user what is the size, the type, or some other characteristic of the data they use. Users only care for the value the meaning of the data has to them. As those of you who follow my articles and postings know, I have been politely critical of the term big data for some time, due its fixation on the size, whilst it is neither the size, velocity, nor the variety that matters, but, the overall complexity—no, not of the data!—the complexity of the problem that you are trying to answer by means of some data. Complex question would be a better name, but not as exciting, I suppose, as big data is. However, from an end-user's, or an analyst's perspectives, it should matter even less what kind of data they are dealing with. I am all for hiding this complexity away from the user, and PolyBase is one of the many small steps that help us get to that goal.
Think of PolyBase as a unification layer, that allows a developer of an application (sadly not quite a typical end-user) not to have to care whether they are querying a normal relational, SQL-like database, or big data, using the HiveQL language, that lets you query the Hive, which stores relational-like (or data warehouse-like) data structures inside your Hadoop Distributed File System (HDFS). It is more than just a query translation tool, as it also knows how to federate the query resolution and how to connect to the underlying layers. We will see many such examples of trying to hide the complexity of working with big data in the near future. Hive is a good place to start, because it is so very much SQL-like. That is why you can also see it in Excel 2013, with the new Hive Query Pane on the Data ribbon. The new Data Explorer for Office 2013 will make even more inroads into making data integration easier for the user—job already well under its way thanks to PowerPivot and the new Excel 2013 Data Model. Ultimately, however, big data makes most sense when it is well integrated as part of your existing BI or analytical platform. I plan to record a video about this strategy, with a HDInsight demo to spice it up, and I will write to you when it is ready.
Web Site Improvements
We've listened to your feedback, and we have made a few improvements to how you find information on the site. All content can now be found under the new Content main menu, which has replaced the old Knowledge link, at the top of the page. There is a new way to see all the titles, without their descriptions, sorted alphabetically, but which you can sort by the publication date, too. Finally, we had to overhaul the content tagging system, now that we have so many modules, and we better know how you like to use them. Have a look at: latest, most popular, or all content, and you will notice the new tags, like Data Mining, MDX, or DAX, which make it even easier to find what is of interest to you. Of course, if you don't know what you want, the best place to start is by looking at the hierarchical table of content, which is grouped by the subject. Let me know if this works for you or if there is any other way we could improve it further. Thanks a million, as they say in Ireland!
March Newsletter Promotion—10% Off!
For our faithful readers who have the stamina to read so far, there is a 10% discount valid on all memberships, until the end of March. Use code NEWSLETTER2013MAR at checkout (don't forget to click "Apply to order"). You can use it to buy a new membership, or to extend your existing one. We have also added new types of group memberships—if you think your organisation could benefit from those, make sure to use this discount code to get the best price, and I thank you for letting your colleagues know about our tutorials.
Thanks for reading and I hope you enjoy your membership,
Rafal Lukawiecki, Strategic Consultant and Director, Project Botticelli Ltd