Excel & SharePoint 2013, Geospatial Maps in Power View and Microsoft Business Analytics—2 New Videos
Newest versions of the just-launched Microsoft platform for analytics
 We have just published two, brand-new videos, by Rafal Lukawiecki, focusing on the the newest release of the Microsoft platform for business analytics, comprising: Office Excel 2013, SharePoint 2013, and SQL Server 2012 SP1. The first, 16-minute video is available free-of-charge to registered members, the second one, 1-hour 20-minute, requires a Full Access Membership:
- Geospatial Data Exploration with Excel Power View and SharePoint free!
- Microsoft Business Analytics with Office 2013, SharePoint 2013 and SQL Server 2012
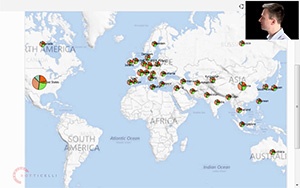
If you ever wanted to create interactive, zoomable maps of the world that show your own data, correctly aggregated by a geographical hierarchy, such as city-region-country, that first video is for you. In just 16 minutes you will see a detailed demo showing you how to use Excel 2013 Power View and Bing Maps to visualise sales numbers, broken down by categories, on an interactive map.
On the other hand, if you would like to get a head-start in business analytics using the Microsoft platform, the second video will help you: the core of that full-length online tutorial is an extensive, 9-part, 55-minute demo that introduces what is new for BI in Excel 2013, SharePoint 2013 and SQL Server 2012 SP1. It will show you how to build powerful, modern, yet attractive, and simple to use business analytics. If you would like to learn even more about this subject, make sure to watch the remaining videos in our series—there is almost 6 hours of material that also covers PowerPivot, BI Semantic Model, and big data.
- Log in to post comments